Health Risk Index Report
The CIEE Health Risk Index (CIEE HRI or HRI) is one of the variables CIEE has been using to assess risk in countries impacted by COVID-19. From the start of the COVID-19 pandemic through today, CIEE has published 69 HRI risk assessments, spanning 29 countries and providing more than 1,900 individual health risk assessments to help our stakeholders and the public make informed decisions regarding the risk of COVID-19. However, and not unexpectedly, more than two and a half years into the pandemic, the open-source data we have used to calculate the index has become more unavailable and unreliable in numerous countries (including the United States).
While there have always been some differences in reporting methods between countries, today there is significant variability among national data sets, making cross-country comparisons less than ideal.
The variability is due in part to the lifting of many travel and in-country restrictions, the shifting of some national policies to a post-pandemic phase, the increase in treatment options, and the increasing availability of at-home-testing causing national undercounts of cases and positivity rates. Additionally, the high infection rates since the emergence of Omicron have caused many public health authorities to shift their focus from case numbers alone to other metrics such as ICU admissions and deaths, which present other data sourcing and risk assessment difficulties.
Because we have incomplete data feeding into our equations from many countries around the globe, we no longer have confidence in the HRI (or any other global risk assessment from third parties) as a reliable metric for assessing COVID-19 risk. As a result, this will be the last CIEE HRI as we shift our focus to building a new risk management metric effort for our stakeholders.
In the coming months, we are working to create a new Index of Student Risk for the countries in which CIEE operates. Utilizing our vast database of past and current safety records over many years, we are developing a metric that incorporates more of the known risk factors outside of COVID-19 (e.g. crime, health, security) that pertain to the unique traveling student populace. So, let’s raise a sterilized glass, lift our masks, and toast the efforts of so many that have brought us this far, whose consistent data reporting and analysis helped us better understand the spread of the pandemic.
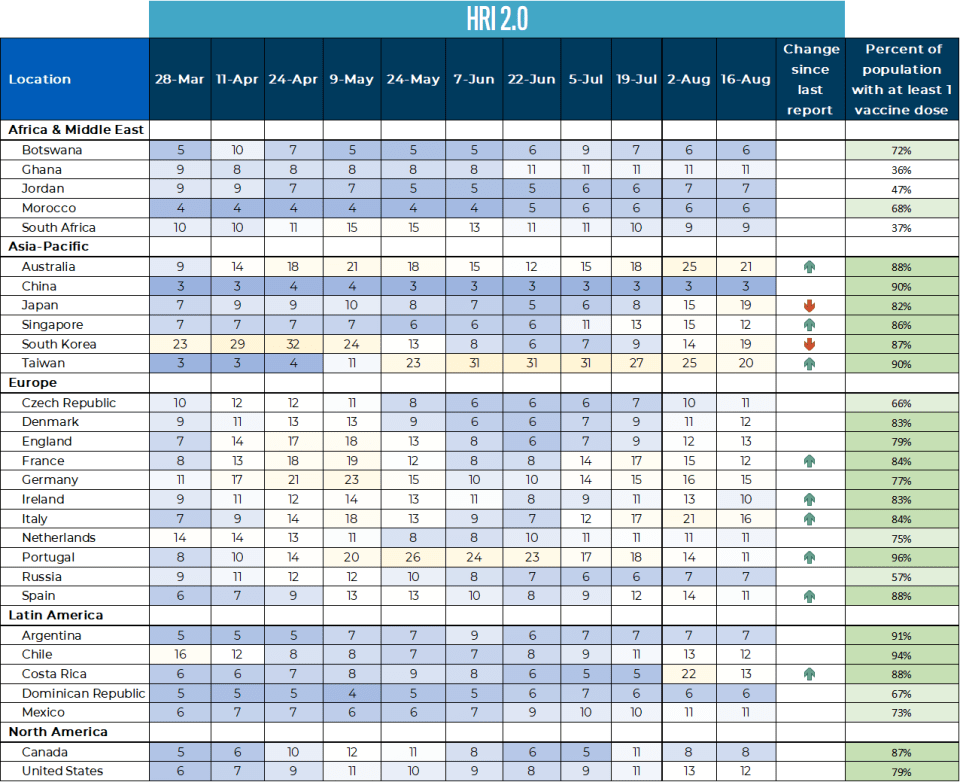
The CIEE Health Risk Index (CIEE HRI or HRI) is one of the variables CIEE uses to assess risk in countries impacted by COVID-19. Since the last HRI report:
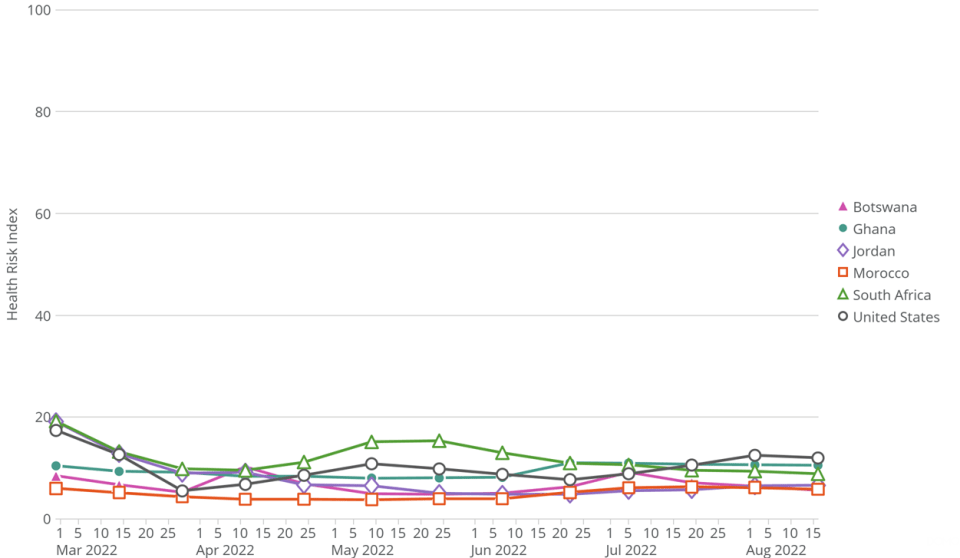
- Africa/Middle East countries remain largely unchanged in risk.
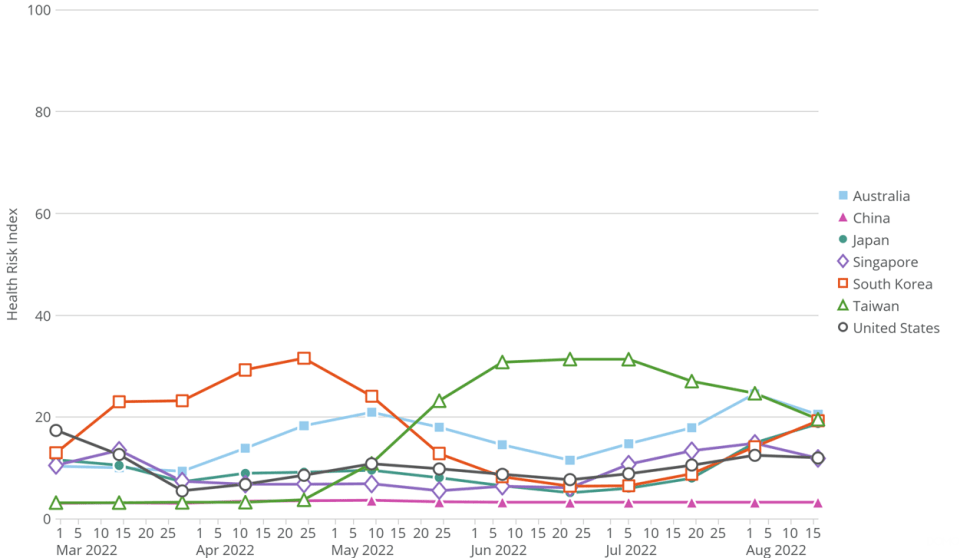
- Asia-Pacific countries indicate an increase in risk in Japan and South Korea, and a decrease in risk in Australia, Singapore, and Taiwan.
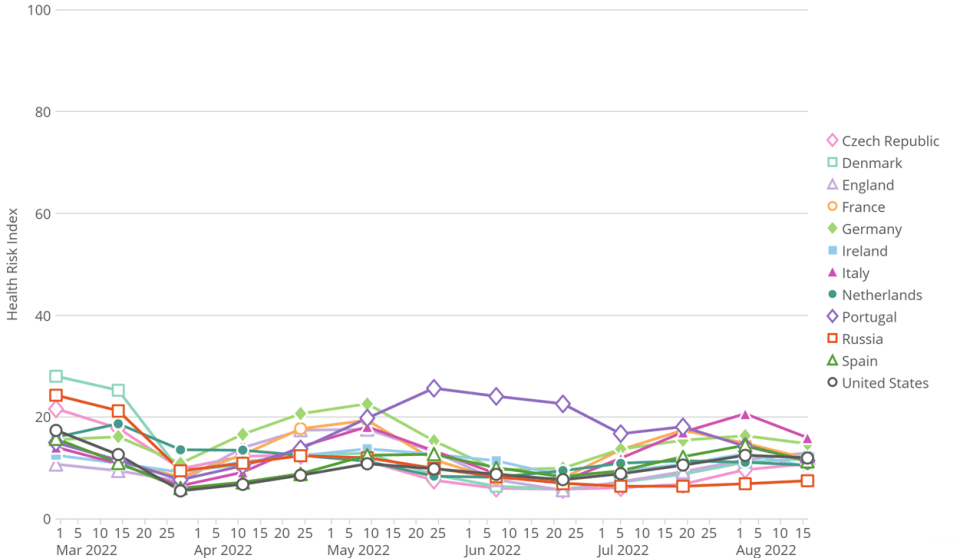
- Europe countries are indicating a decrease in risk in France, Ireland, Italy, Portugal, and Spain.
- Latin America countries indicate a decrease in risk in Costa Rica.
- North America countries remain largely unchanged in risk.
CIEE strongly recommends that all students get a COVID-19 vaccination booster prior to departure if it has been six months since their second Pfizer or Moderna shot or two months since they received the single-dose Johnson & Johnson vaccine. Students should not rely on being able to get booster shots abroad as this is far from certain in most cases. Students can find a location near them to get their booster prior to departure by visiting Vaccines.gov.
In order to safeguard the health of the whole CIEE community, we are also strongly encouraging all staff, instructors, and homestay families to get their COVID-19 vaccination booster shot as soon as they are eligible.
About the HRI:
- The index is a numerical value from 1 to 100 where higher numbers indicate higher risk as assessed by our calculations.
- The lower the number, the fewer risk factors that will require mitigation.
- Arrows represent changes to the index of greater than two points - green arrows if the change was in the direction of lower risk; red if the change was in the direction of increased risk.
- The values are for comparative purposes only and are calculated weekly or biweekly so we may assess changes over time.
- The values do not represent absolute risk, and there are no universal thresholds at which CIEE would or would not run a program.
- Data is provisional and subject to change. Some risk values for past weeks may change occasionally as countries and/or data source sites update their past data to reflect more accurate information such as case and death counts for specific days.
-
The vaccination column does not take into account vaccine type/brand. There are additional vaccines beyond the three authorized in the US being used throughout the world, which in studies have shown differing efficacy rate.
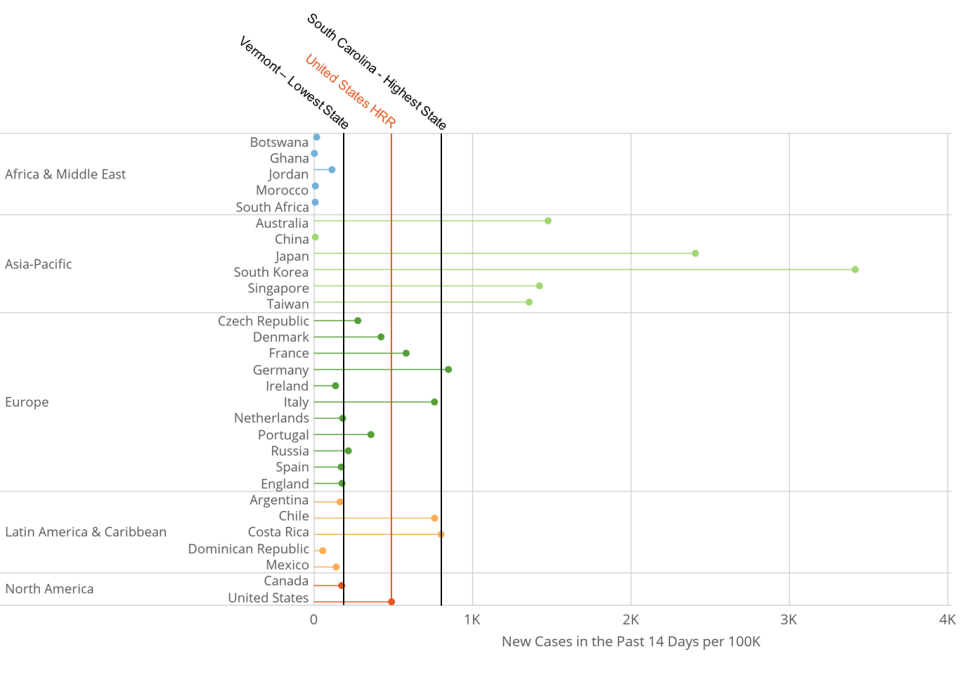
Community Transmission by Country
In the figure above you can see how the level of community transmission (as measured by new cases in the past 14 days per 100,000 people) in different countries compares with community spread in the United States as a whole (the red line). Because local COVID-19 impact is wildly variable across the United States, for additional comparison, there is a line to indicate community spread in the state with the lowest community spread and highest community spread.
Health Risk Indices by Region
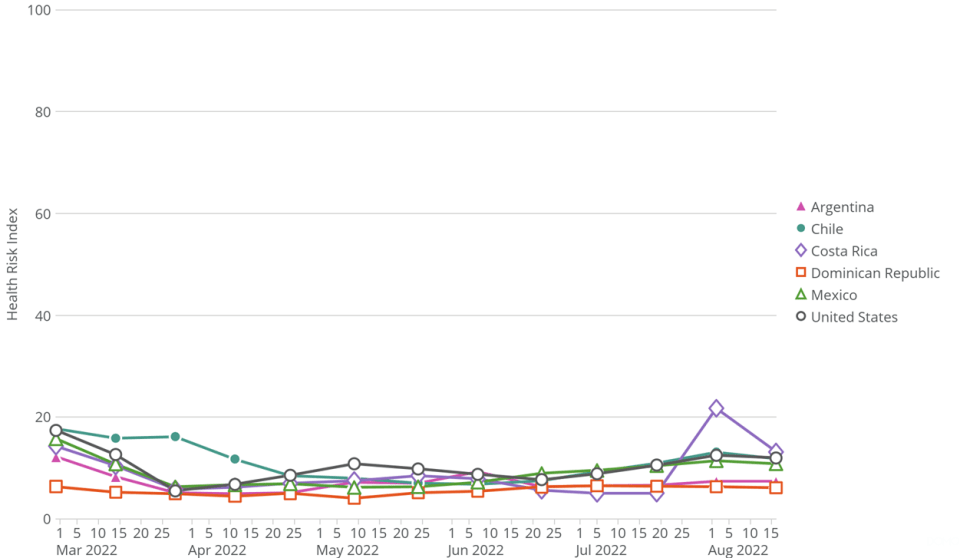
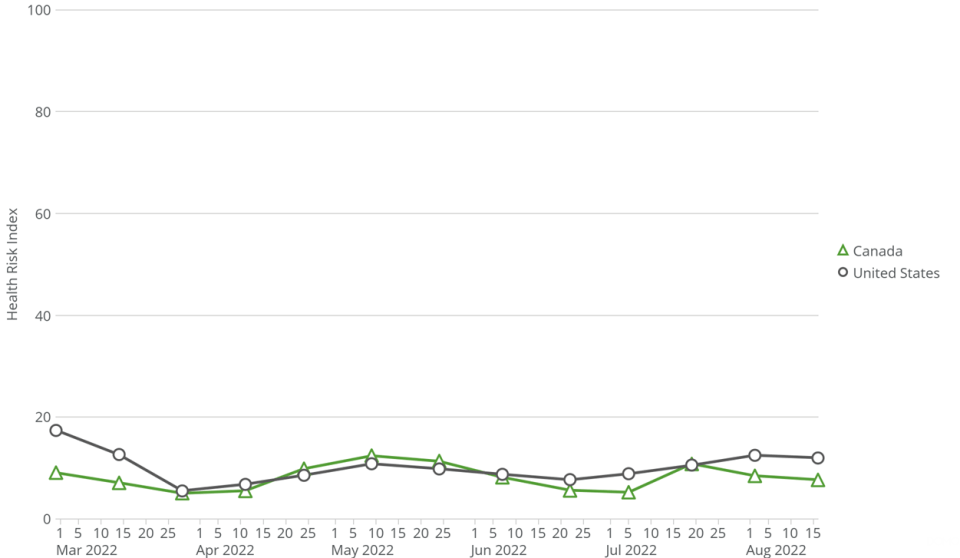
Below are five figures offering an additional way to visualize the changes to the HRI over time. Each figure shows the HRI from March 1, 2021 through August 15, 2022 for countries within a region. In each figure, the y-axis shows HRI values from 0 - 100. Because a lower HRI value indicates a lower risk as assessed by our calculations, a downward slope represents a decrease in risk (a.k.a. an improvement in conditions).

